What's New?
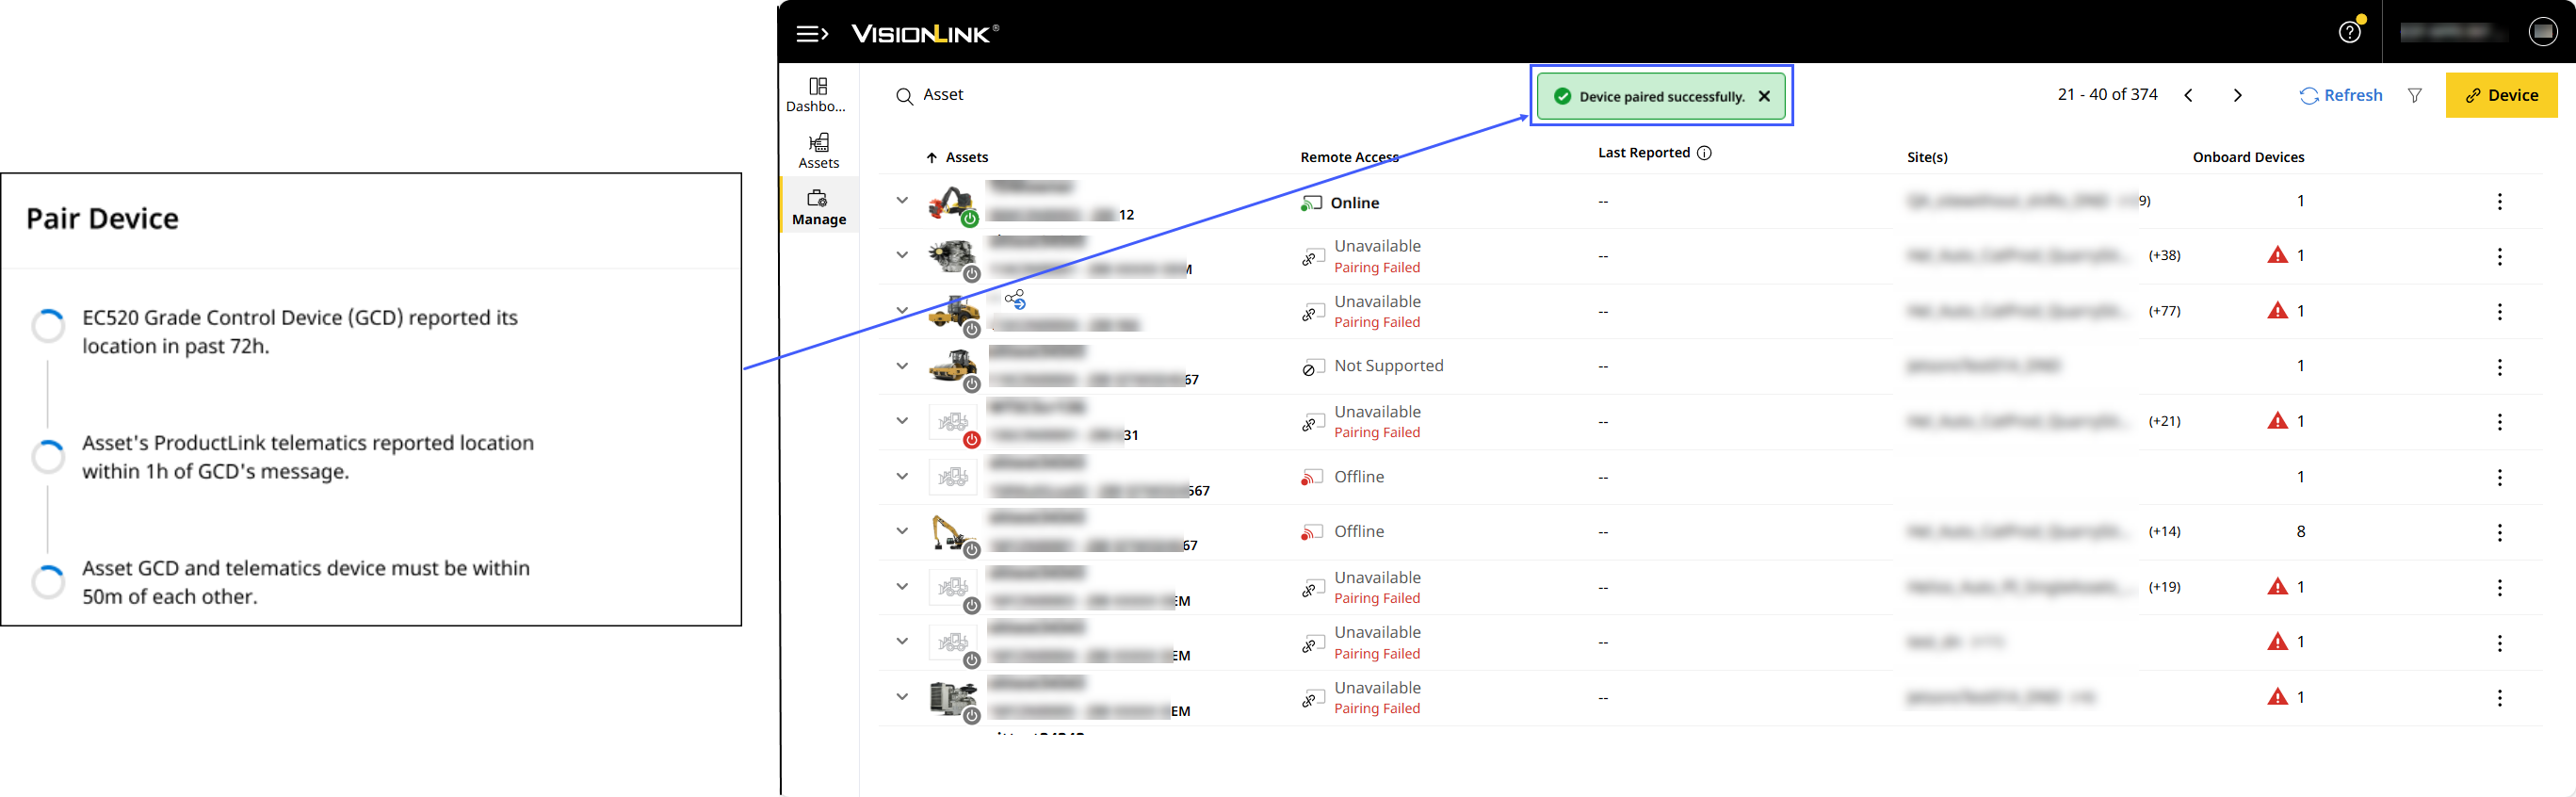
Utilize VisionLink’s Grade Features via Third-party Systems
Now, pair assets with EC520 grade control devices (GCDs) to enable all VisionLink Grade features without needing a factory-installed network manager (PLE742/PLE743).
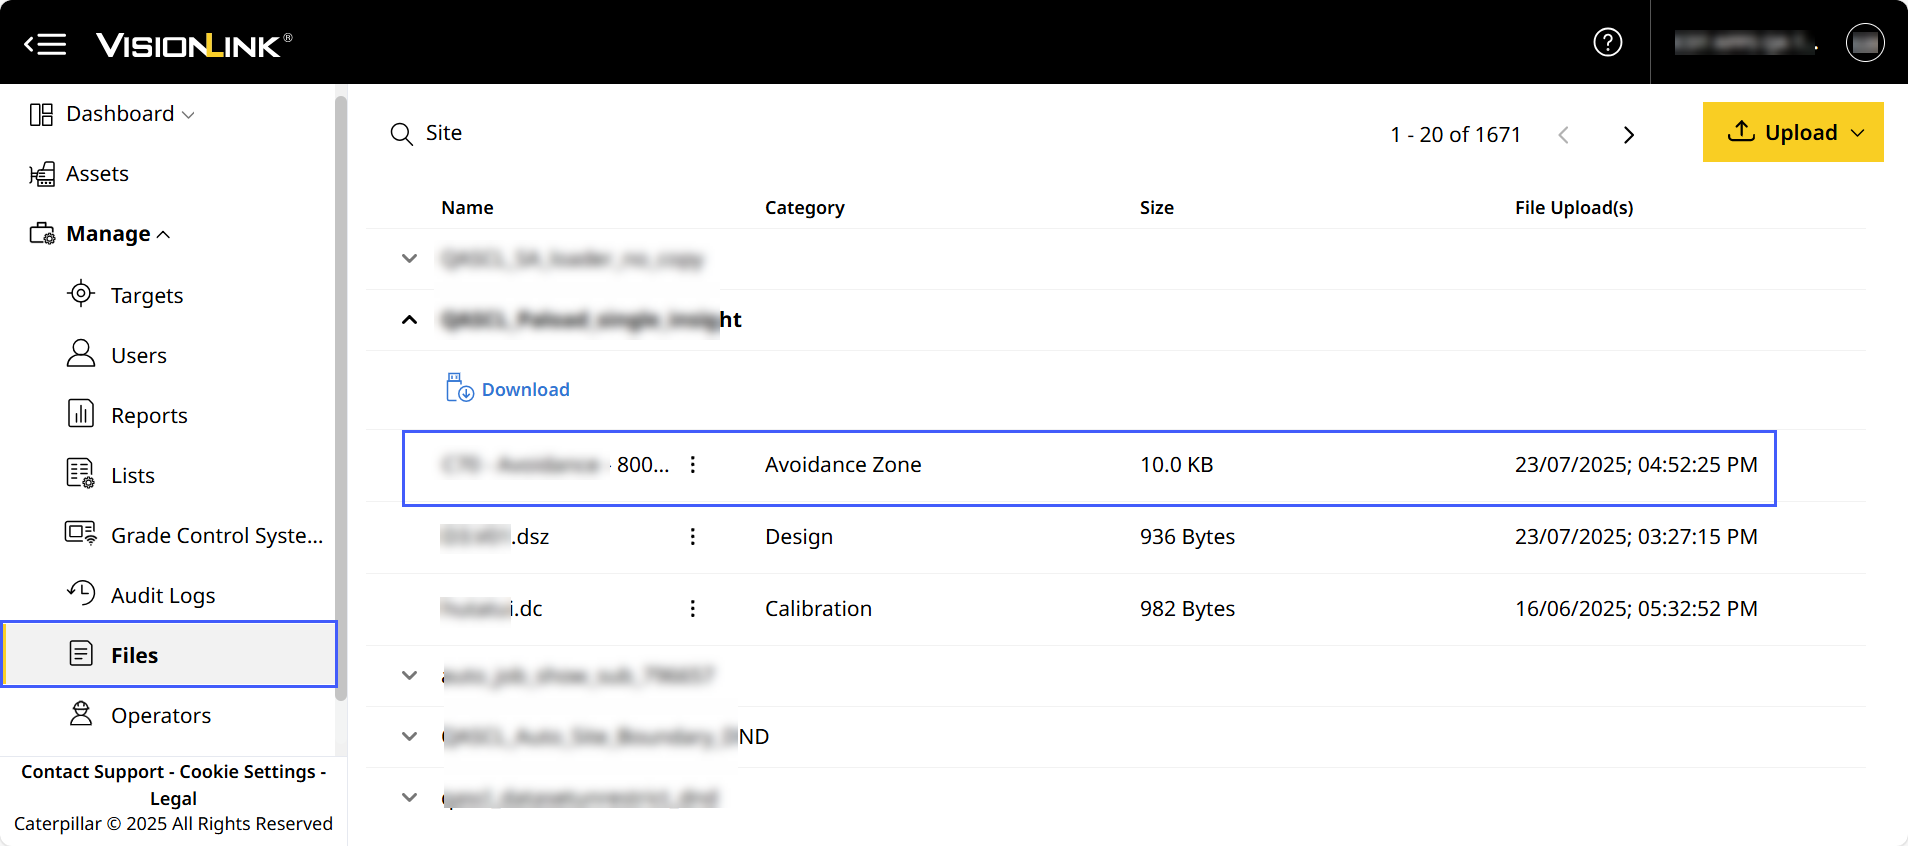
Upload and Preview 2D Avoidance Zone File
Now, remotely upload avoidance zone files (avoid.svl) and preview the zones before syncing the file to the site’s assets. This displays onboard, alerting operators about restricted and hazardous areas, mitigating risk and ensuring efficiency.
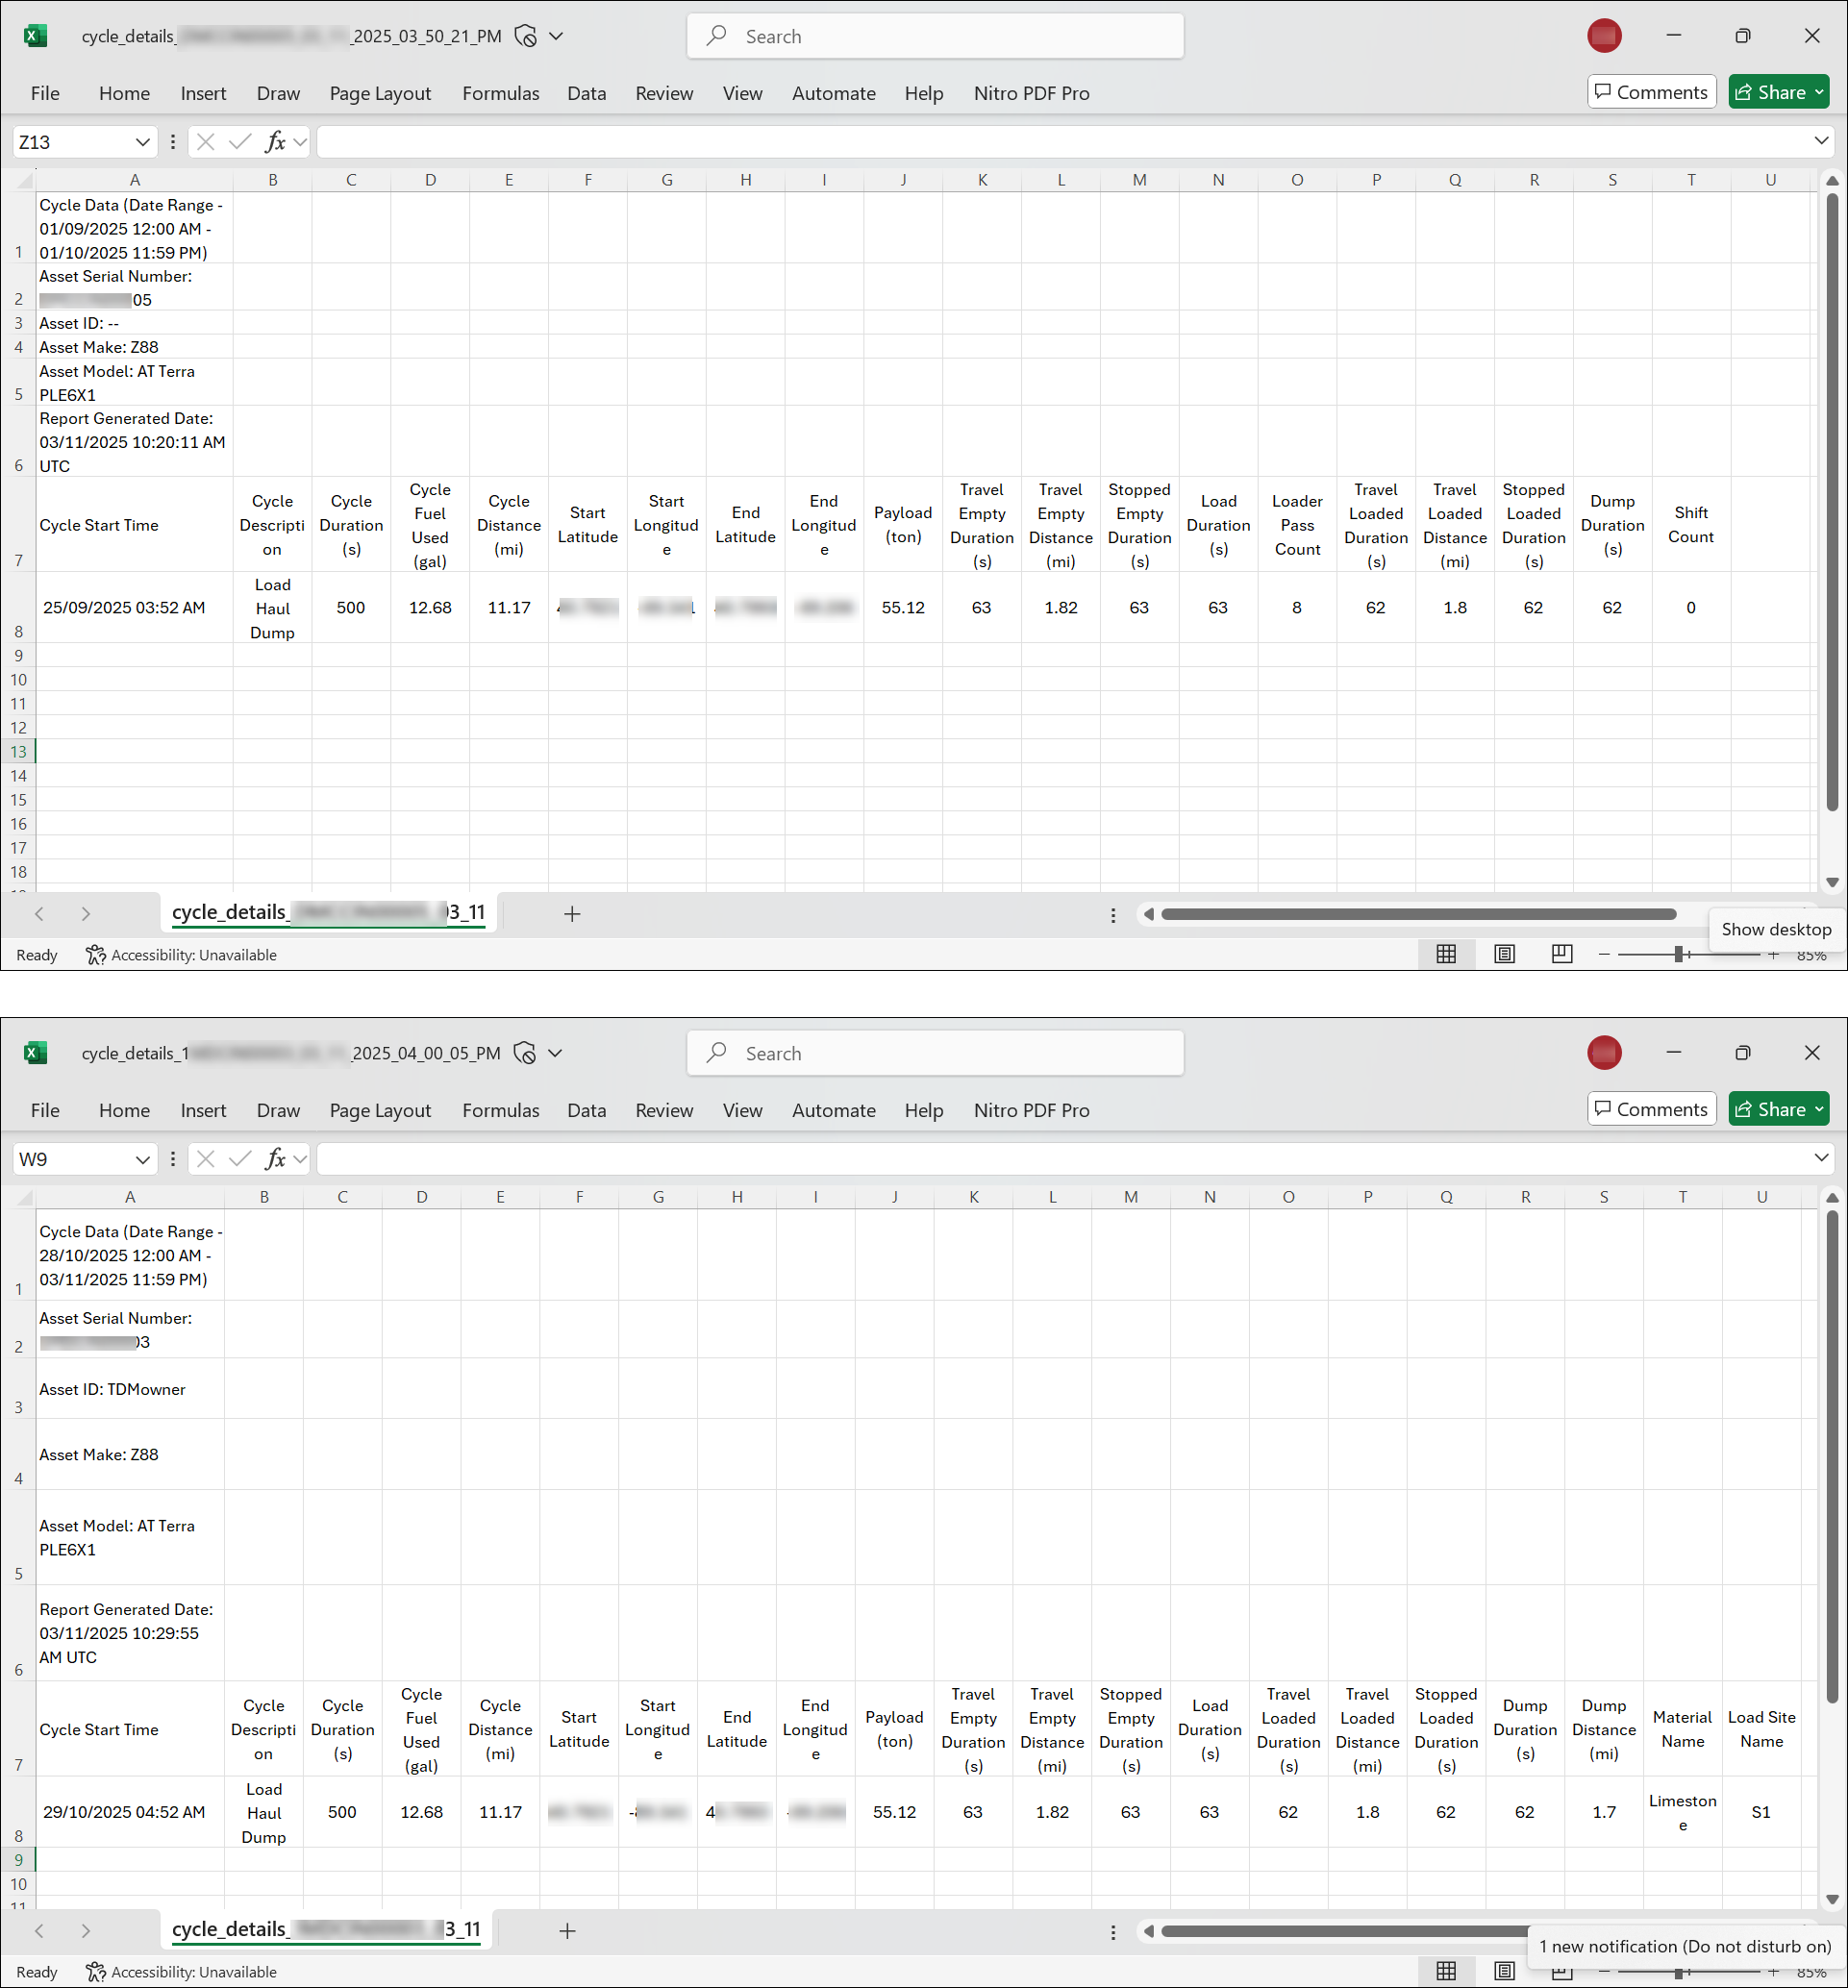
Schedule and Download Cycle Reports with Product Family-specific Columns
Now, schedule and download cycle details reports that are specific to product family preferences. For specific product families, the report will include tailored new columns to give you more relevant insights.
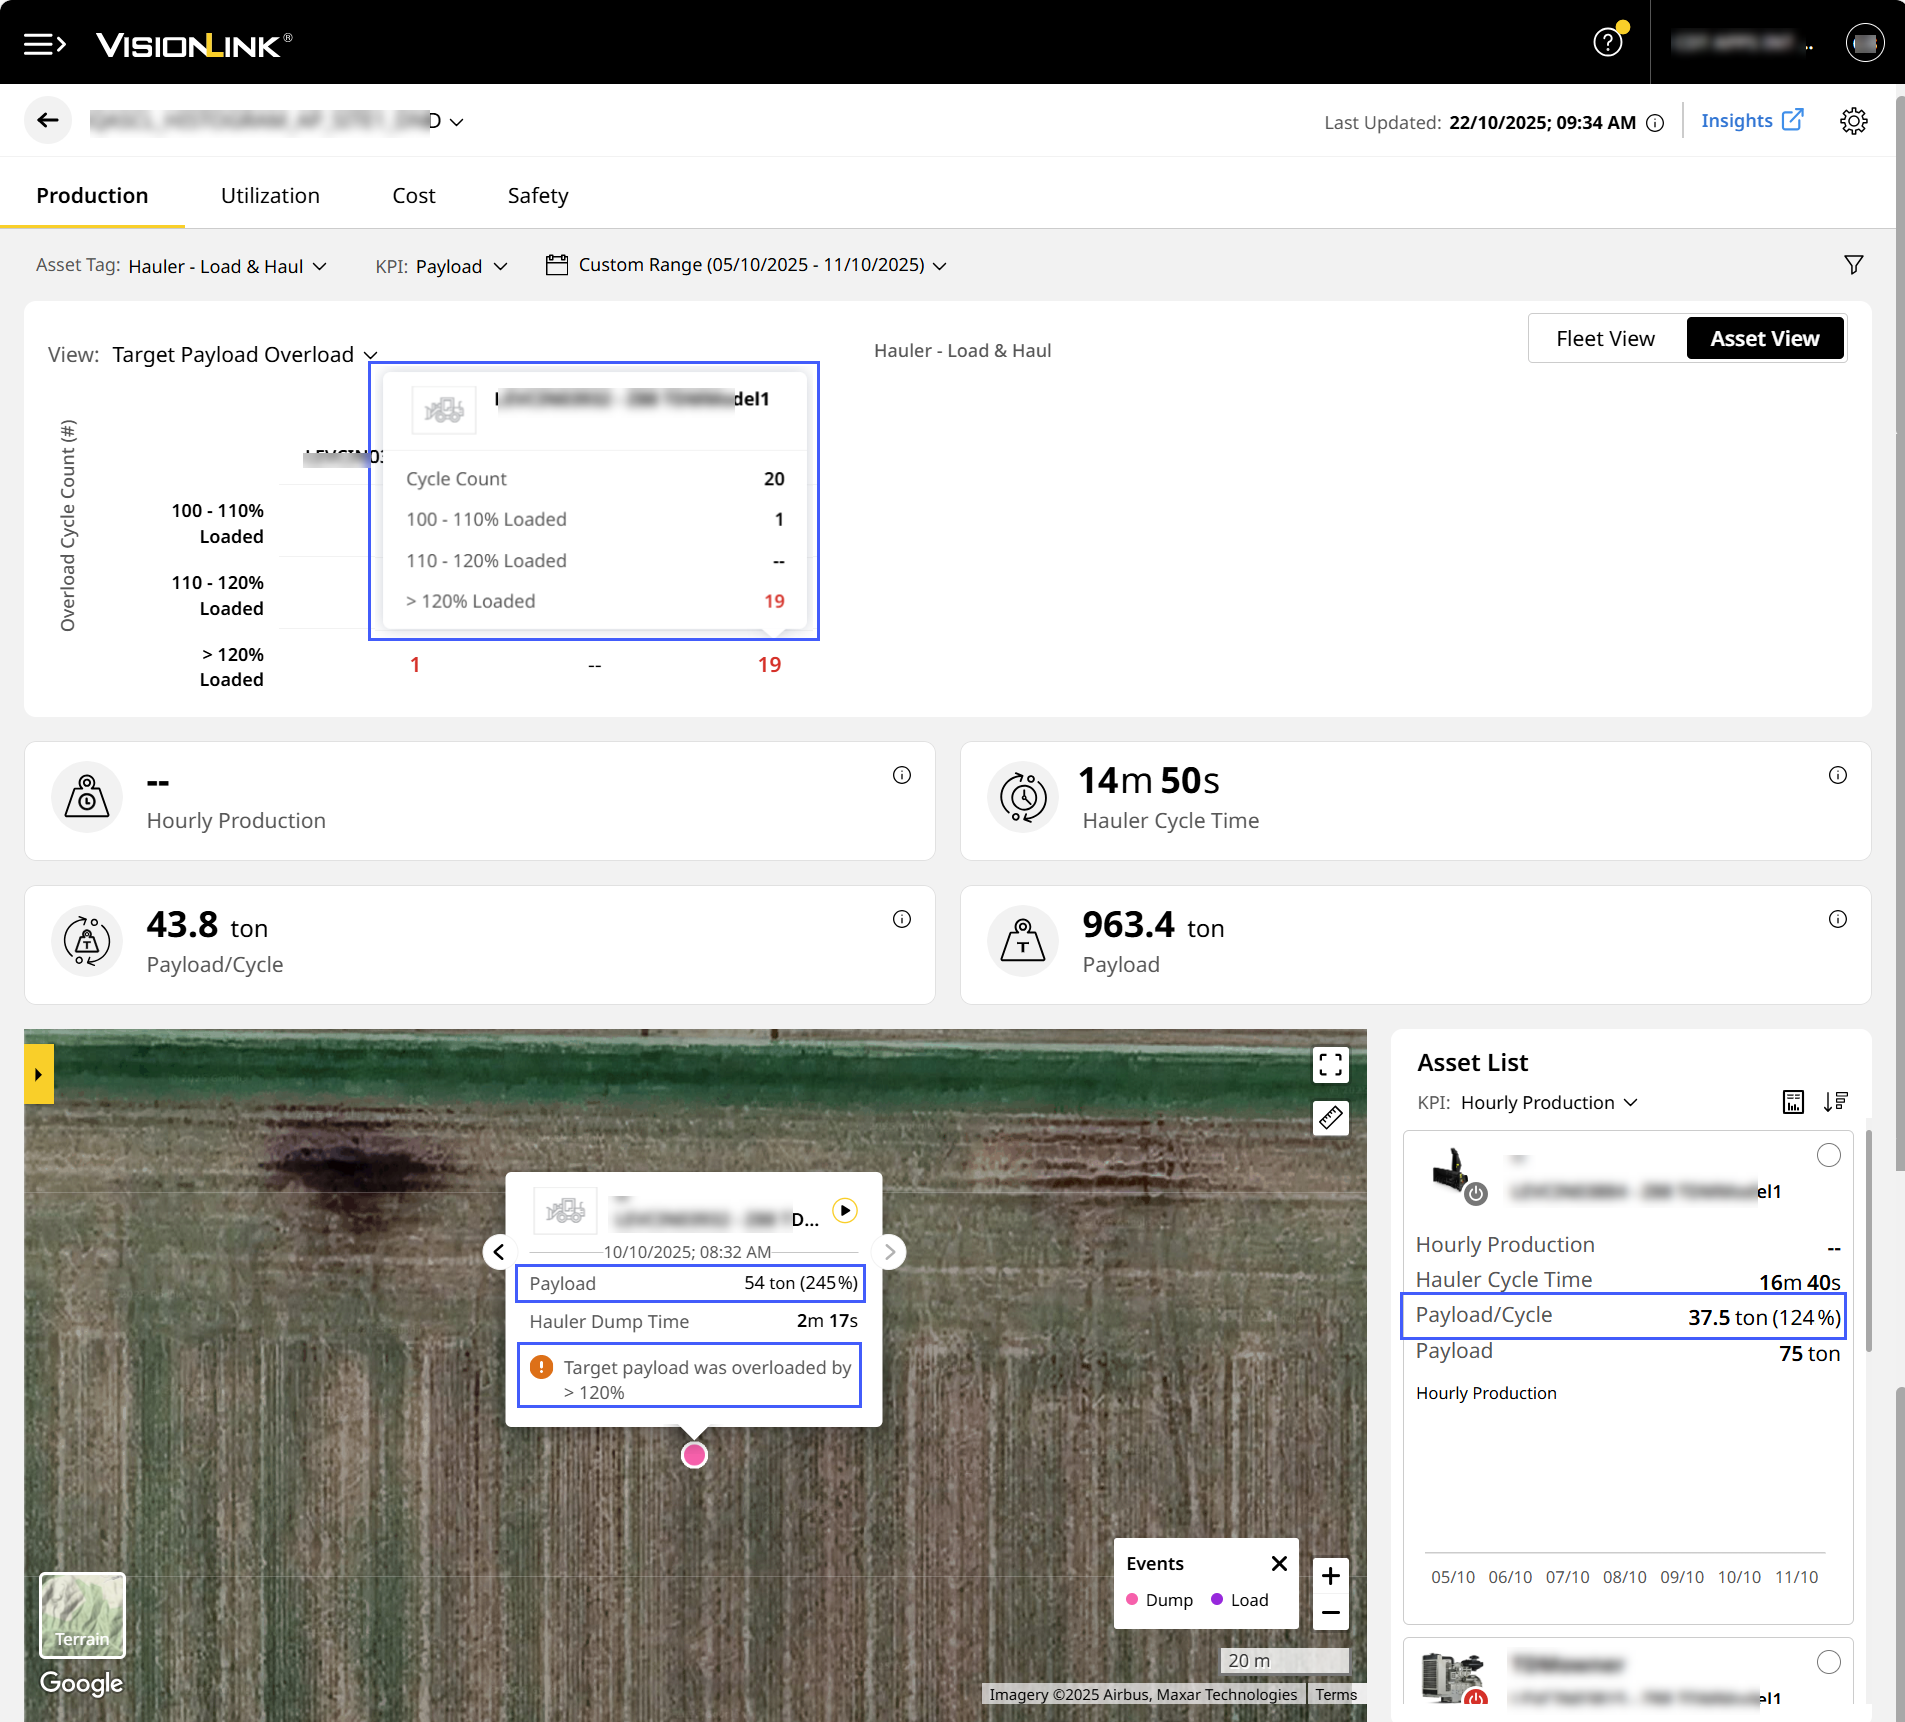
Improve Payload Overload Visibility
Now, track and filter payload overloading from the new 100-110% range, along with the existing 110–120% and >120% ranges. On Site Summary Asset List and Map View, view the payload percentage alongside payload value, with overloading alerts for quick assessment of loading efficiency.
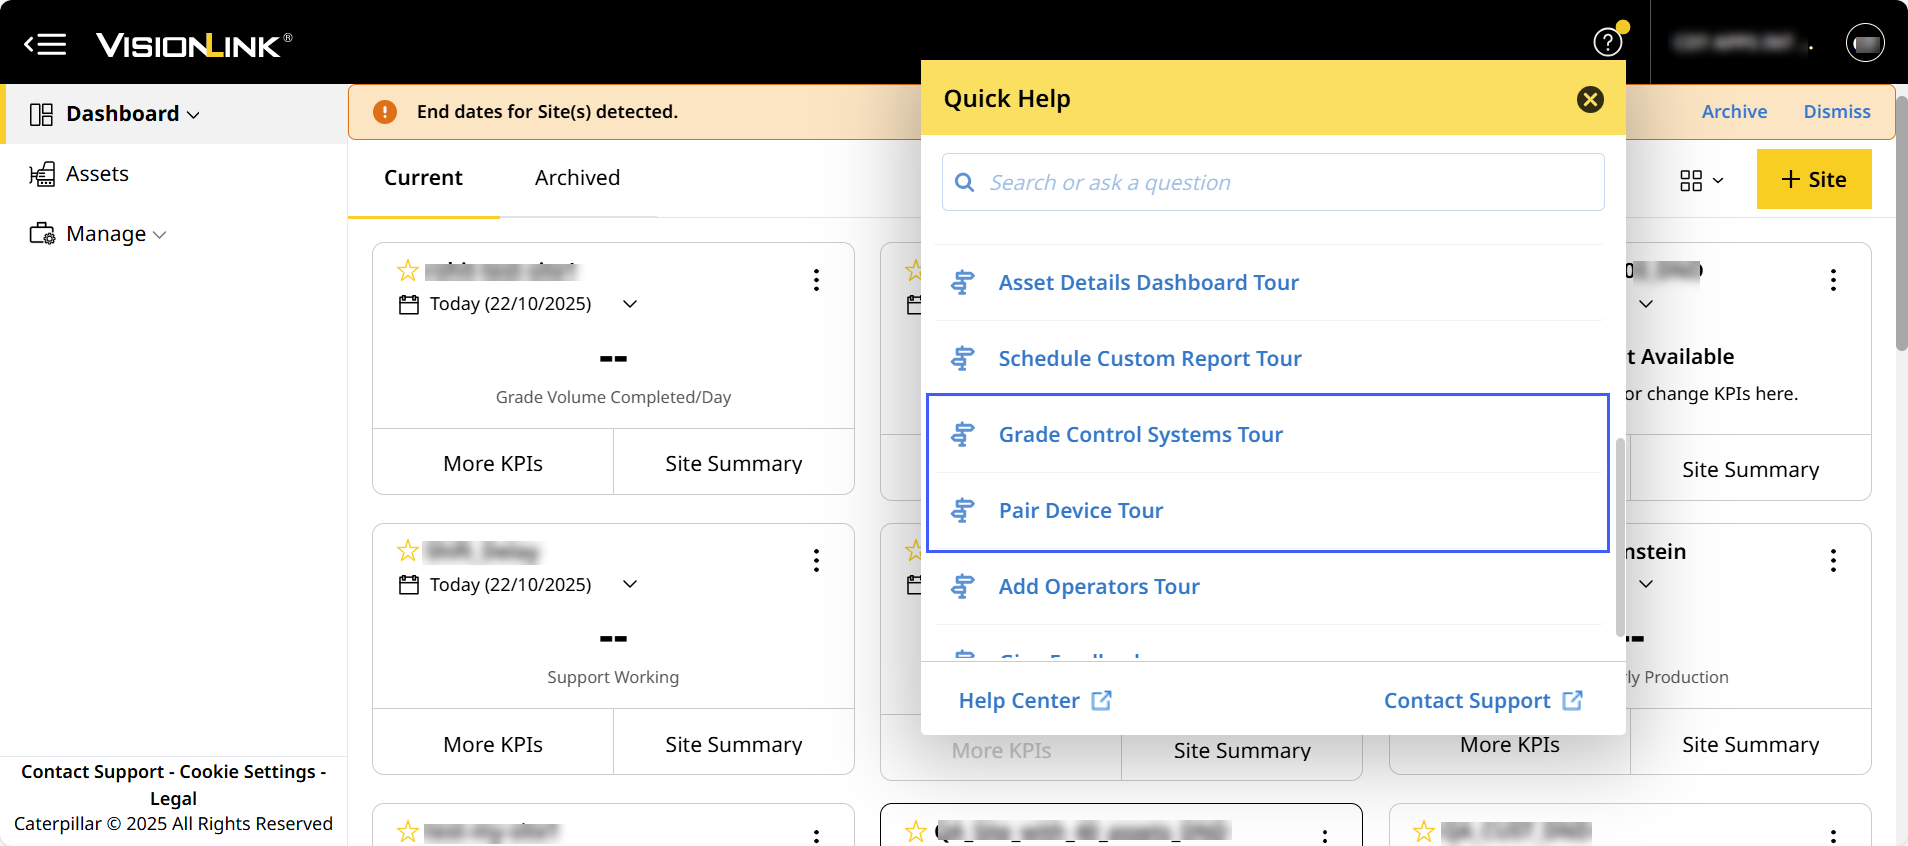
Explore Grade Control System and Device Pairing with Guided Tours
The following guided tours help with:
- Learning about the Grade Control Systems including its features and benefits for improving grade accuracy.
- Understanding how to pair a grade control device (GCD) with an asset enabling efficient integration and performance.